1.决策树算法
一、什么是决策树/判定树decision tree?
判定树是一个类似于流程图的树结构:其中,每个内部结点表示在一个属性上的测试,每个分支代表一个属性输出,而每个树叶结点代表类或类分布。树的最顶层是根结点。 属于机器学习中分类方法中的一个重要算法
二、构造决策树的基本算法

三、熵(entropy)概念:
信息和抽象,如何度量?
1948 年,香农提出了 信息熵(entropy)的概念 一条信息的信息量大小和它的不确定性有直接的关系,要搞清楚一件非常非常不确定的事情,或者 是我们一无所知的事情,需要了解大量信息==>信息量的度量就等于不确定性的多少
例子:猜世界杯冠军,假如一无所知,猜多少次?
每个队夺冠的几率不是相等的 比特(bit)来衡量信息的多少

变量的不确定性越大,熵也就越大
四、决策树归纳算法
- 1970-1980, J.Ross. Quinlan, ID3 算法 选择属性判断结点 信息获取量
(Information Gain):Gain(A) = Info(D) - Infor_A(D)通过 A 来作为节点分类获取了多少信息
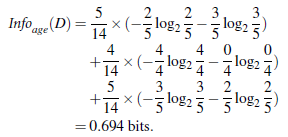

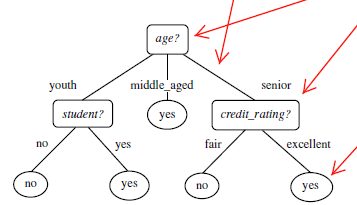
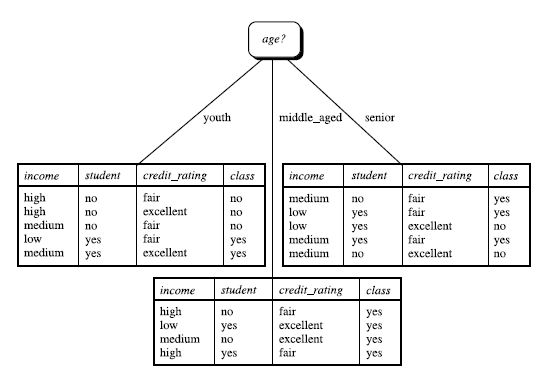
类似,Gain(income) = 0.029, Gain(student) = 0.151, Gain(credit_rating)=0.048 所以,选择 age 作为第一个根节点
- 算法:
- 树以代表训练样本的单个结点开始(步骤 1)。
- 如果样本都在同一个类,则该结点成为树叶,并用该类标号(步骤 2 和 3)。
- 否则,算法使用称为信息增益的基于熵的度量作为启发信息,选择能够最好地将样本分类的属性(步骤 6)。该属性成为该结点的“测试”或“判定”属性(步骤 7)。在算法的该版本中,
- 所有的属性都是分类的,即离散值。连续属性必须离散化。
- 对测试属性的每个已知的值,创建一个分枝,并据此划分样本(步骤 8-10)。
- 算法使用同样的过程,递归地形成每个划分上的样本判定树。一旦一个属性出现在一个结点上,就不必该结点的任何后代上考虑它(步骤 13)。
- 递归划分步骤仅当下列条件之一成立停止:
- (a) 给定结点的所有样本属于同一类(步骤 2 和 3)。
- (b) 没有剩余属性可以用来进一步划分样本(步骤 4)。在此情况下,使用多数表决(步骤 5)。
- 这涉及将给定的结点转换成树叶,并用样本中的多数所在的类标记它。替换地,可以存放结
- 点样本的类分布。 (c) 分枝
- test_attribute = a i 没有样本(步骤 11)。在这种情况下,以 samples 中的多数类
- 创建一个树叶(步骤 12)
- 其他算法: C4.5: Quinlan Classification and Regression Trees (CART): (L. Breiman, J. Friedman, R. Olshen, C. Stone) 共同点:都是贪心算法,自上而下(Top-down approach) 区别:属性选择度量方法不同: C4.5 gain ratio, CART(gini index), ID3 (Information Gain)
如何处理连续性变量的属性?
树剪枝叶 (避免 overfitting) 先剪枝、后剪枝
决策树的优点:直观,便于理解,小规模数据集有效
决策树的缺点:
- 处理连续变量不好
- 类别较多时,错误增加的比较快
- 可规模性一般
五、如何实现决策树应用
1. Python 机器学习的库:scikit-learn
- 特性
- 简单高效的数据挖掘和机器学习分析
- 对所有用户开放,根据不同需求高度可重用性
- 基于 Numpy, SciPy 和 matplotlib
- 开源,商用级别:获得 BSD 许可
- 覆盖问题领域:
- 分类(classification)、 回归(regression)、 聚类(clustering)、 降维(dimensionality reduction)、模型选择(model selection)、预处理(preprocessing)
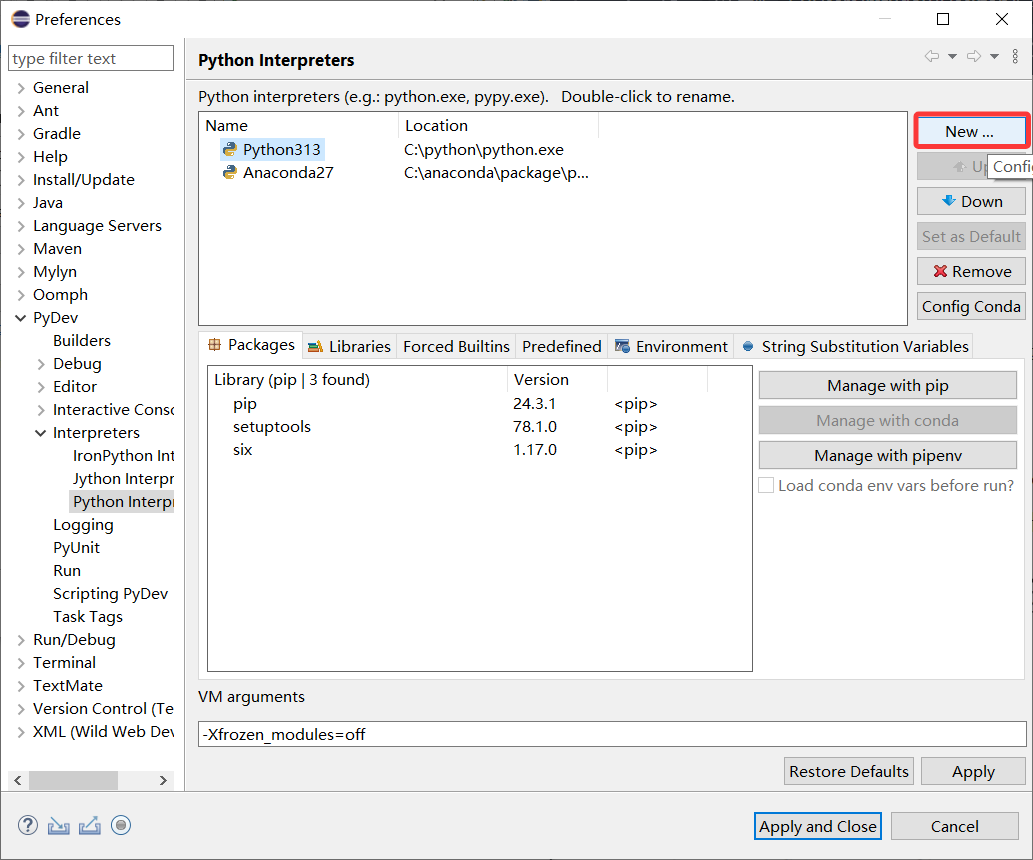
- 安装并使用
scikit-learn
打开
Anaconda官网并找到对应版本进行下载
在安装的文件夹路径下找到对应的
python.exe,并复制C:\anaconda\package该路径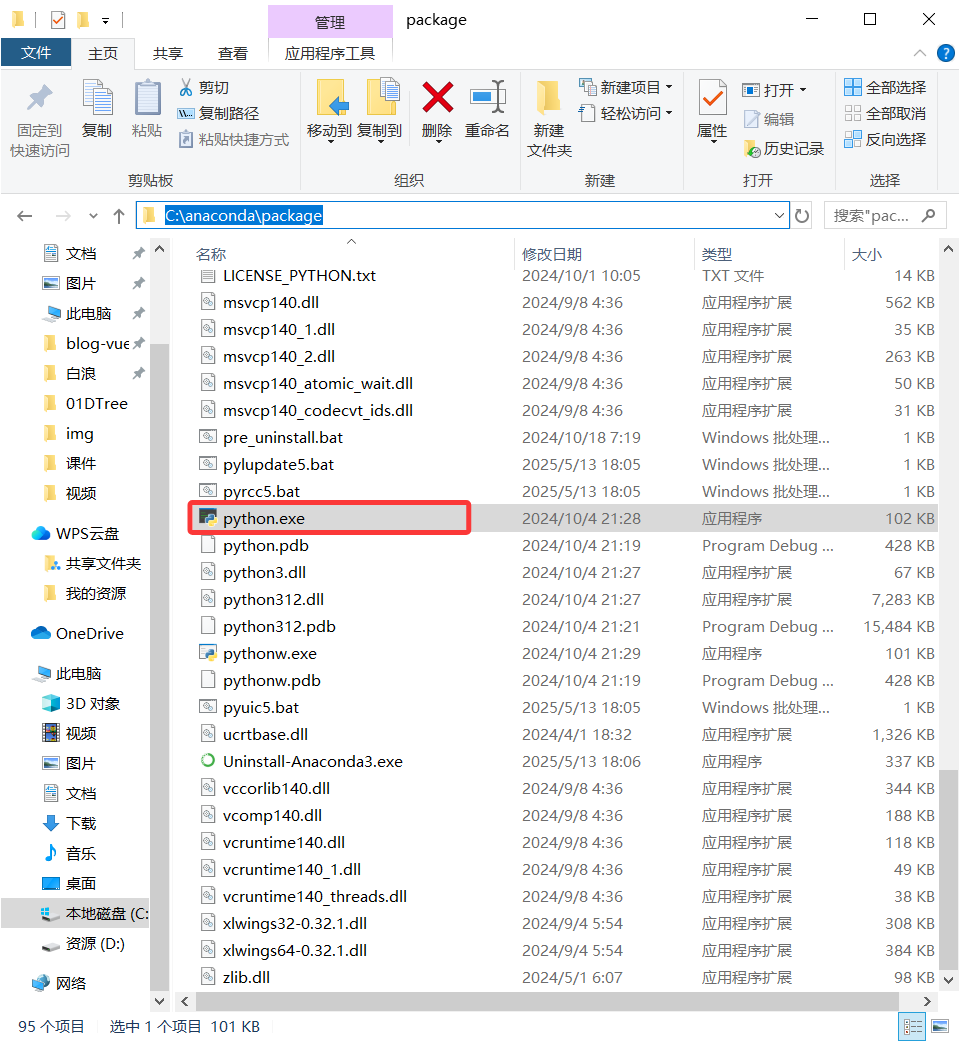
在
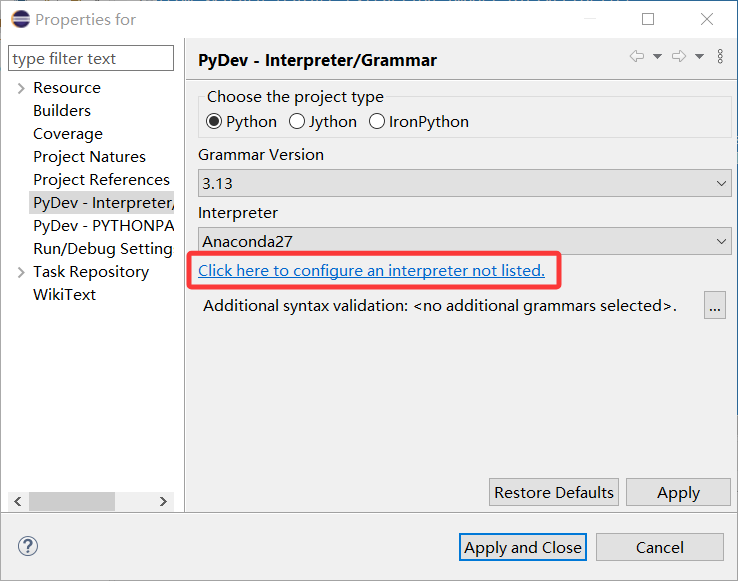
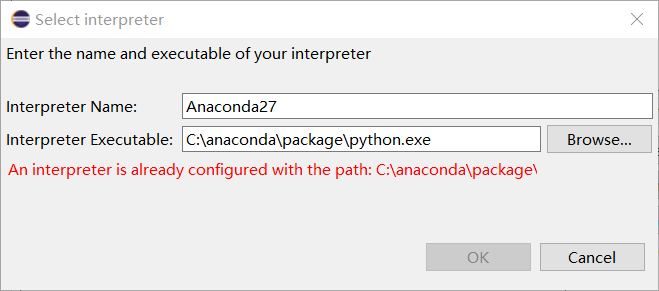
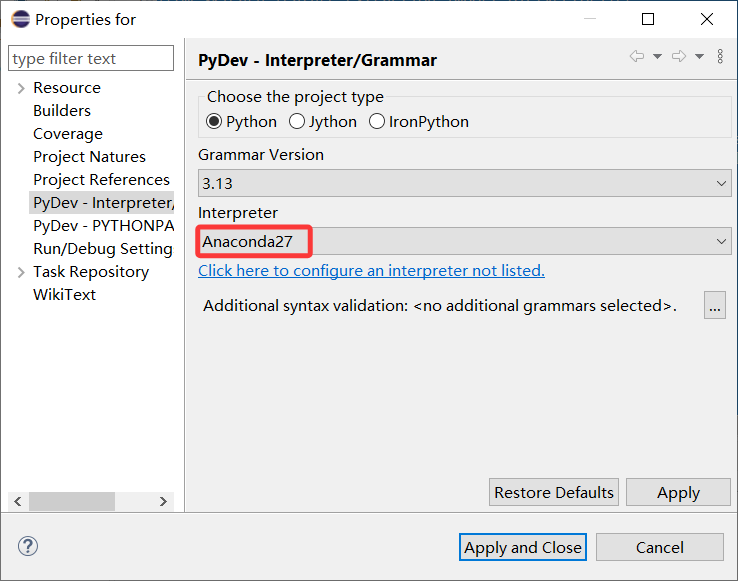
Eclipse IDE工具中添加Anaconda
Alt+Enter快捷键打开属性(properties)功能,然后PyDev- Interpreter/Grammar中Interpreter中点击Click here to configure an interpreter not listed.添加python.exe的路径
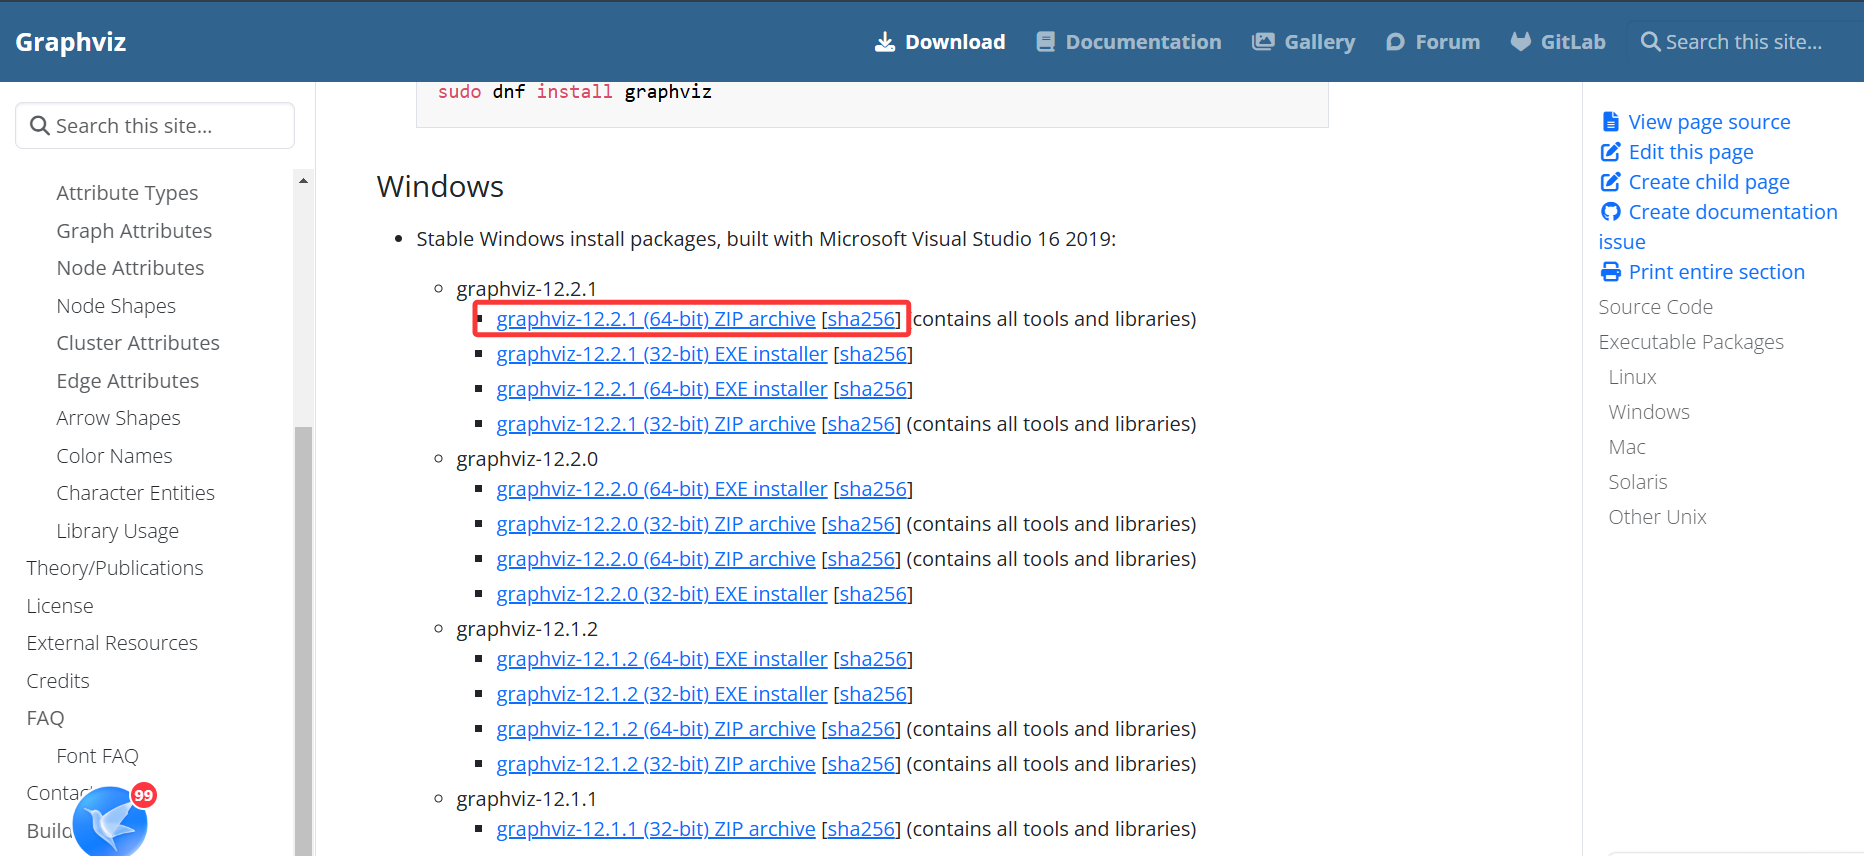
2、安装Graphviz
- 下载
Graphviz
- 配置环境变量
系统变量 -》 path -》 新建 -》
C:\Graphviz-12.2.1-win64\bin
- 转化 dot 文件至 pdf 可视化决策树:
dot -Tpdf "itis.dot" -o "itis.pdf"
如在 Windows 上,可以使用命令提示符(CMD)或 PowerShell。
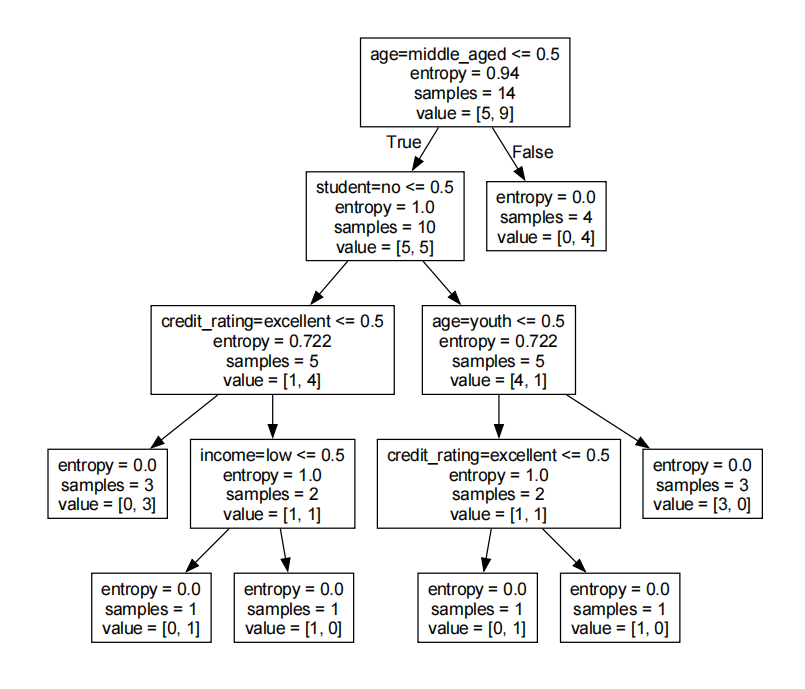
digraph Tree {
node [shape=box, fontname="helvetica"] ;
edge [fontname="helvetica"] ;
0 [label="age=middle_aged <= 0.5\nentropy = 0.94\nsamples = 14\nvalue = [5, 9]"] ;
1 [label="student=no <= 0.5\nentropy = 1.0\nsamples = 10\nvalue = [5, 5]"] ;
0 -> 1 [labeldistance=2.5, labelangle=45, headlabel="True"] ;
2 [label="credit_rating=excellent <= 0.5\nentropy = 0.722\nsamples = 5\nvalue = [1, 4]"] ;
1 -> 2 ;
3 [label="entropy = 0.0\nsamples = 3\nvalue = [0, 3]"] ;
2 -> 3 ;
4 [label="income=low <= 0.5\nentropy = 1.0\nsamples = 2\nvalue = [1, 1]"] ;
2 -> 4 ;
5 [label="entropy = 0.0\nsamples = 1\nvalue = [0, 1]"] ;
4 -> 5 ;
6 [label="entropy = 0.0\nsamples = 1\nvalue = [1, 0]"] ;
4 -> 6 ;
7 [label="age=youth <= 0.5\nentropy = 0.722\nsamples = 5\nvalue = [4, 1]"] ;
1 -> 7 ;
8 [label="credit_rating=excellent <= 0.5\nentropy = 1.0\nsamples = 2\nvalue = [1, 1]"] ;
7 -> 8 ;
9 [label="entropy = 0.0\nsamples = 1\nvalue = [0, 1]"] ;
8 -> 9 ;
10 [label="entropy = 0.0\nsamples = 1\nvalue = [1, 0]"] ;
8 -> 10 ;
11 [label="entropy = 0.0\nsamples = 3\nvalue = [3, 0]"] ;
7 -> 11 ;
12 [label="entropy = 0.0\nsamples = 4\nvalue = [0, 4]"] ;
0 -> 12 [labeldistance=2.5, labelangle=-45, headlabel="False"] ;
}
dot -Tpdf "D:\allElectronicInformationGainOri.dot" -o "D:\allElectronicInformationGainOri.pdf"
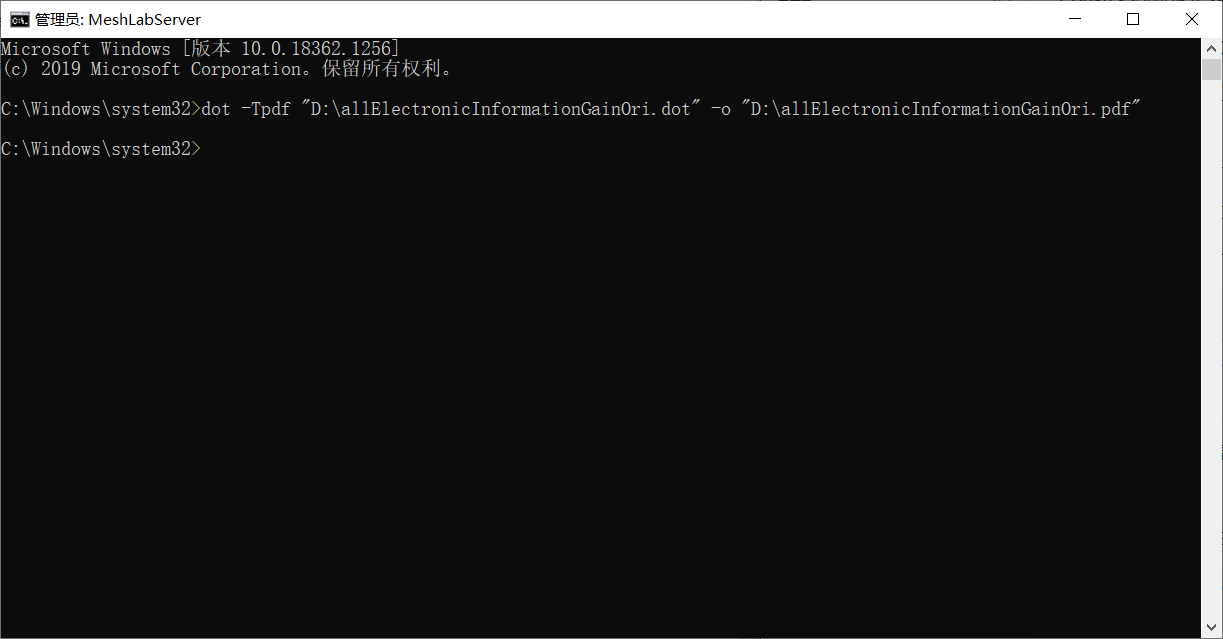
可以将dot文件转换为pdf文件
3、决策树应用源码
安装scikit-learn和six模块
pip install scikit-learn
pip install six
AllElectronics.csv
| RID | age | income | student | credit_rating | class_buys_computer |
|---|---|---|---|---|---|
| 1 | youth | high | no | fair | no |
| 2 | youth | high | no | excellent | no |
| 3 | middle_aged | high | no | fair | yes |
| 4 | senior medium | no | fair | yes | |
| 5 | senior | low | yes | fair | yes |
| 6 | senior | low | yes | excellent | no |
| 7 | middle_aged | low | yes | excellent | yes |
| 8 | youth | medium | no | fair | no |
| 9 | youth | low | yes | fair | yes |
| 10 | senior | medium | yes | fair | yes |
| 11 | youth | medium | yes | excellent | yes |
| 12 | middle_aged | medium | no | excellent | yes |
| 13 | middle_aged | high | yes | fair | yes |
| 14 | senior | medium | no | excellent | no |
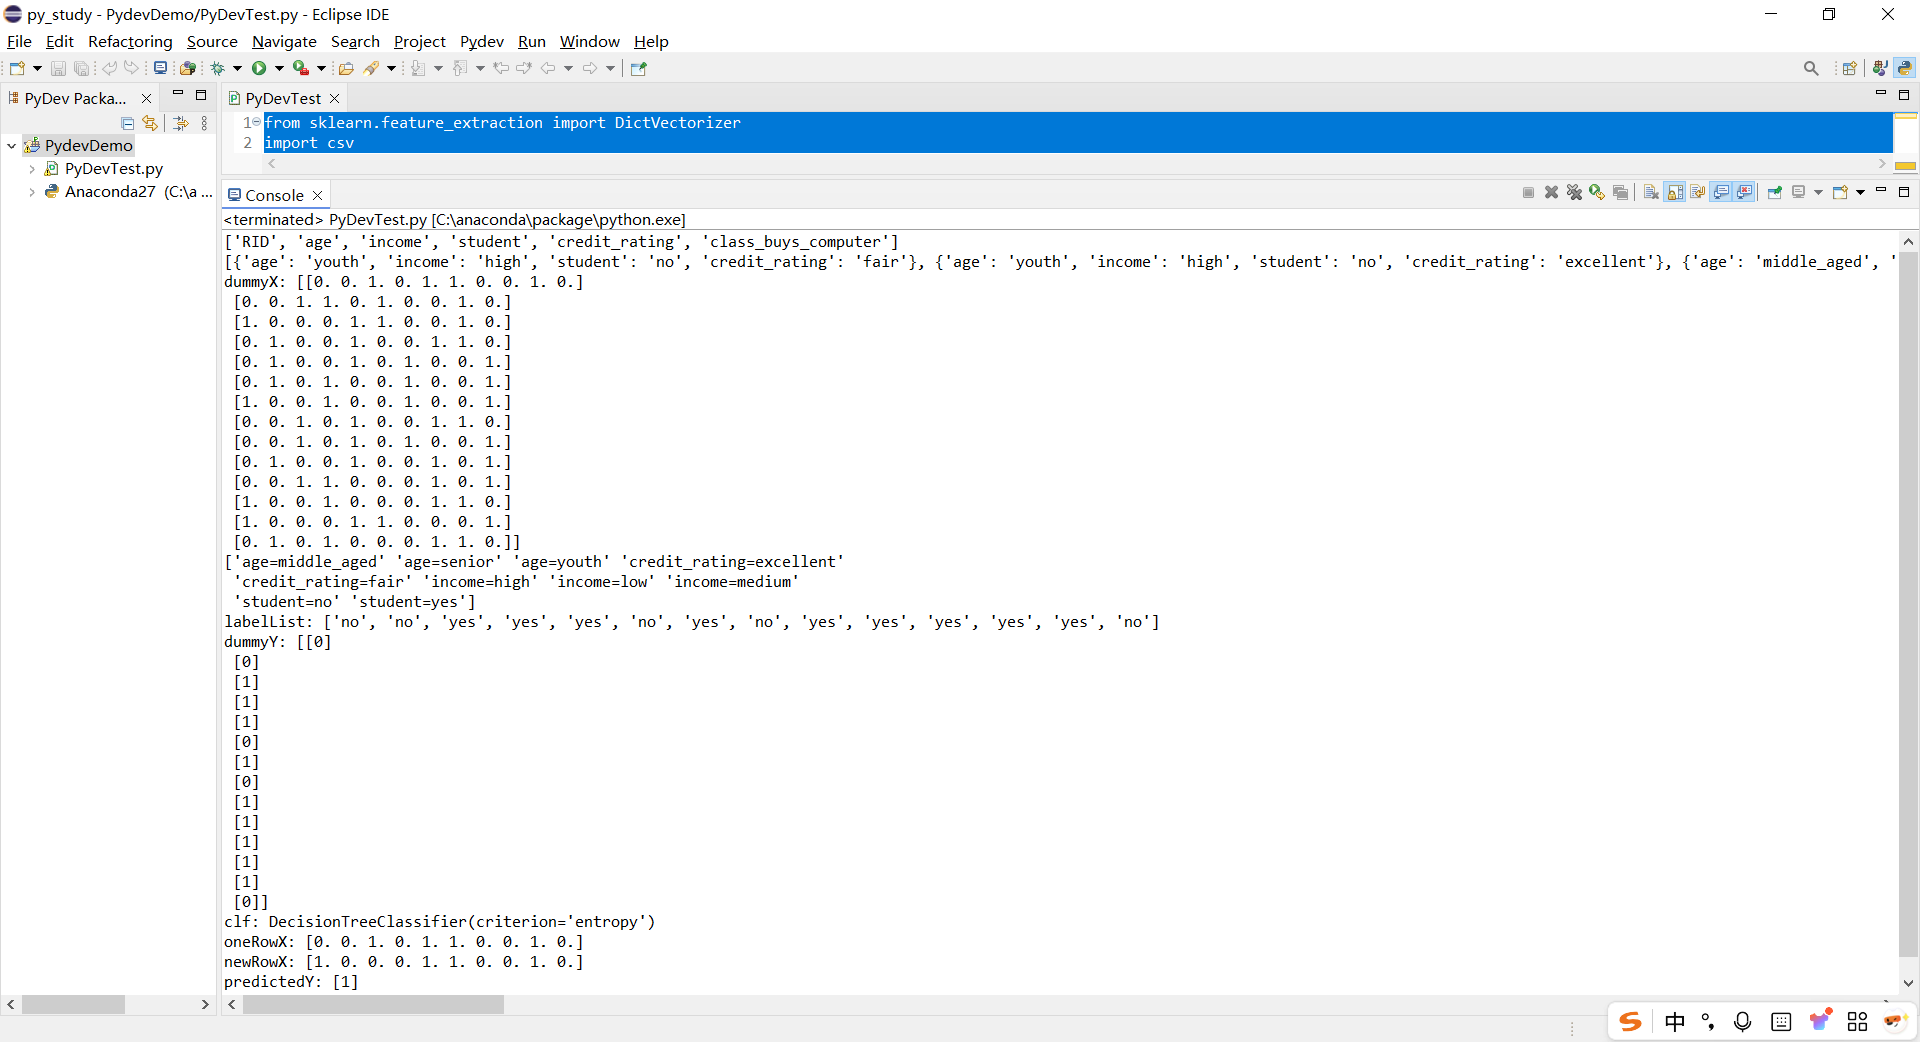
from sklearn.feature_extraction import DictVectorizer
import csv
from sklearn import tree
from sklearn import preprocessing
import six
from six import StringIO

# Read in the csv file and put features into list of dict and list of class label
with open(r'D:\AllElectronics.csv', 'r', encoding='utf-8') as allElectronicsData:
    reader = csv.reader(allElectronicsData)
    headers = next(reader)  # 使用next函数获取表头

    print(headers)

    featureList = []
    labelList = []

    for row in reader:
        labelList.append(row[len(row)-1])
        rowDict = {}
        for i in range(1, len(row)-1):
            rowDict[headers[i]] = row[i]
        featureList.append(rowDict)

    print(featureList)

# Vectorize features
vec = DictVectorizer()
dummyX = vec.fit_transform(featureList).toarray()

print("dummyX: " + str(dummyX))
print(vec.get_feature_names_out())  # 使用 get_feature_names_out()

print("labelList: " + str(labelList))

# Vectorize class labels
lb = preprocessing.LabelBinarizer()
dummyY = lb.fit_transform(labelList)
print("dummyY: " + str(dummyY))

# Using decision tree for classification
# clf = tree.DecisionTreeClassifier()
clf = tree.DecisionTreeClassifier(criterion='entropy')
clf = clf.fit(dummyX, dummyY)
print("clf: " + str(clf))

# Visualize model
with open(r'D:\allElectronicInformationGainOri.dot', 'w') as f:
    f = tree.export_graphviz(clf, feature_names=vec.get_feature_names_out(), out_file=f)

oneRowX = dummyX[0, :]
print("oneRowX: " + str(oneRowX))

newRowX = oneRowX
newRowX[0] = 1
newRowX[2] = 0
print("newRowX: " + str(newRowX))

predictedY = clf.predict([newRowX])  # 注意这里需要传入一个二维数组
print("predictedY: " + str(predictedY))
点击run运行